The top section of this page is your Quality Dashboard. This view shows you quality measure performance for your whole organization. You will see a warning message when you are below the 75% data completeness requirement. .

Reportable Patients - all patients with Qualifying Encounter AND Performance Met (C) or Performance Not Met (CNP) or Exception (EXP) or Incomplete (INC) status.
Complete Patients - all patients with Qualifying Encounter AND Performance Met (C) or Performance Not Met (CNP) or Exception (EXP) status.
Incomplete Patients - all patients with a Qualifying Encounter AND do NOT have a Performance Met (C), Performance Not Met (CNP), Exception (EXP), or Exclusion (EXC) answer.
Data Completeness - Complete Patients divided by Reportable Patients *100.
Performance Met - all patients with performance response AND qualifying encounter
Exception - all patients with exception response AND qualifying encounter
Performance Not Met - all patients with non-performance response AND qualifying encounter.
Performance Rate - Performance Met / (Complete Patients-Exception). Your performance rate will be shown on the Benchmark Deciles chart to the right.
Performance Points - Points are scored as in the example below. The points column will show zero points until the 75% threshold has been met.

40th Percentile Estimation Calculator -
This tool allows users to see if they are expected to reach the CMS 40th percentile (73.85 for 2026) for their overall quality score. This score is based on all quality measures you are submitting to CMS along with 2 claims-based measures and the CAHPS Survey.
Clicking on the 40th Percentile Estimation Calculator will open a calculator for estimating your quality score.

The estimated quality score for each of the 5 measures we are tracking will show in the scoring estimator based on your current data in Health Endeavors.
Users can add estimated scores for the two claims-based measures (479 and 484) and the CAHPS Survey measure (321)
You will see an estimated score at the bottom of the screen. This will be updated as your data is updated in Health Endeavors.
This is just an estimate and your actual final score from CMS could be different due to factors we are not able to calculate.
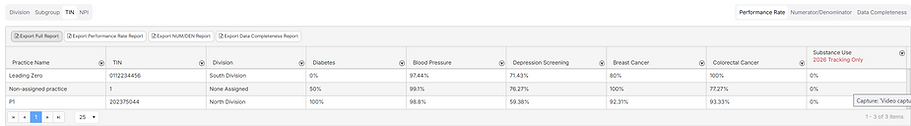
The bottom section of this page is the Quality Network Dashboard. Users will have the ability to view how each division, practice, location or provider contributes to the overall ACO score.
If you are a division, SubGroup or practice level user, you will only have access to view the patients assigned to you.
Users have the ability to switch between viewing performance rates, numerator/denominator numbers and data completeness using the button at the top right of this view.
This view is available at provider, subgroup, practice or division level by using the buttons on the top left of this view.
Users have the option to export the Full Report (numerator/denominator, Performance Rate and Data Completeness), a Performance Rate, a Numerator/Denominator or Data Completeness report by clicking on the buttons at the top of the report.